The temperature you see on the CBR-301 is not the temperature of your beans. It is the temperature of the air inside the roasting chamber.
This is not a limitation; it is simply how the machine works. Understanding the difference changes how you read everything.
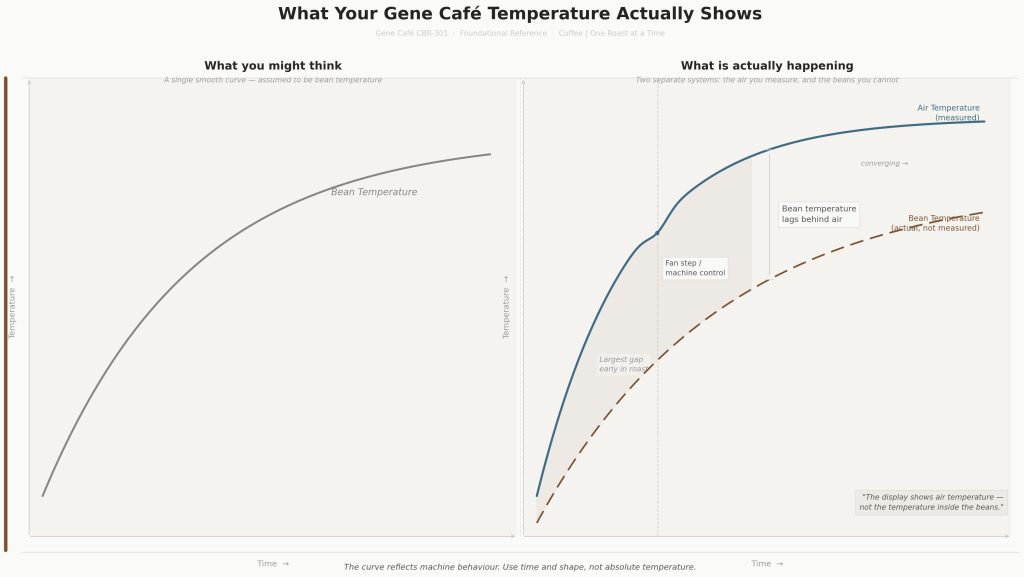
Illustrative, not measured. The gap between air and bean temperature is largest at the start of the roast and narrows as the roast progresses.
What the machine is measuring
The CBR-301 is a convection roaster. Hot air is heated, pushed through the chamber, and circulates around the beans as they tumble. The temperature sensor sits in that airstream, measuring the environment the beans are sitting in, not the beans themselves.
The beans are a separate system. They heat more slowly than air, release moisture during roasting, and continuously change how heat moves through the chamber. At any moment, the display shows conditions around the beans, not the exact state inside them.
What this looks like in practice
Early in the roast: the temperature rises quickly. This is the air heating up, not the beans. The beans are still absorbing energy and are significantly cooler than the display suggests. The steep early curve is real data, but it reflects machine energy, not bean development.
While not representing bean temperature, this early behaviour is highly useful for understanding how much energy the machine is delivering at the start of the roast.
Mid to late roast: as moisture release changes and heat transfer stabilises, the curve becomes more correlated with what the beans are doing. The two systems are still not the same, but they are converging.
The fan step: the machine actively manages its internal environment. Around the 4-minute mark, and sometimes again after 200°C, fan speed adjusts automatically. When this happens, the curve may flatten, dip, or change slope. This is the machine managing its own thermal state, and that behaviour is visible in the curve.
How to read the curve
If the curve reflects machine behaviour rather than bean temperature, the next question is how to actually read it.
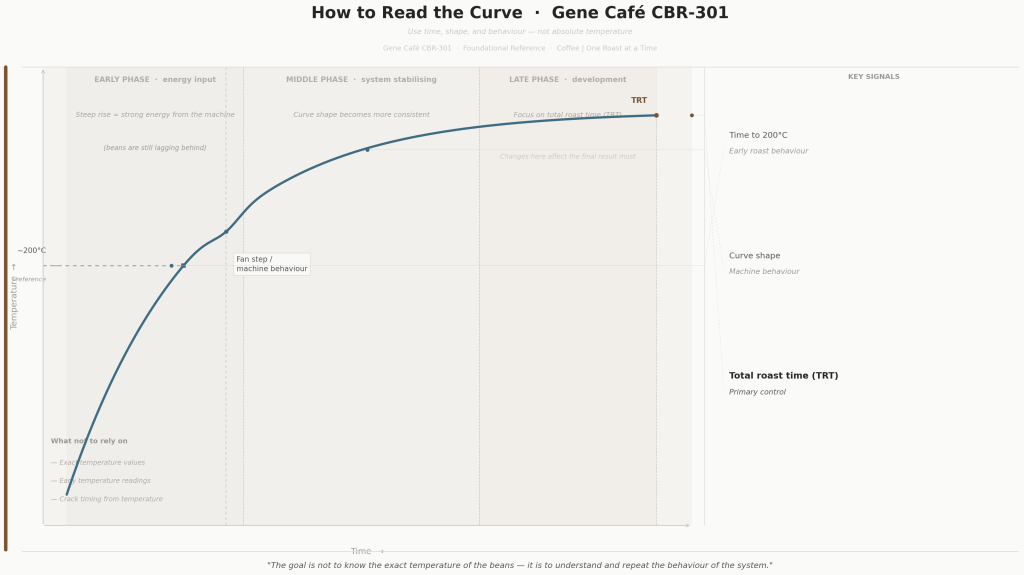
The curve is best understood as a fingerprint of machine behaviour, not a direct measurement of the beans. That is different from bean behaviour, but over time, it becomes just as useful.
What you can trust
- Relative movement (rising, plateauing, accelerating)
- Time to 200°C
- Time to 230°C
- Total roast time (TRT)
- Overall curve shape
What you cannot trust
- Any single reading as bean temperature
- Early readings as bean development
- Crack timing from temperature alone
The curve gives you a reliable window into how the machine is behaving. Log it, compare it, and look for changes, not absolute values. Even as the curve stabilises, it never becomes a direct measurement of bean temperature.
Practical takeaway
The goal is not to know the exact temperature of the beans — it is to understand and repeat the behaviour of the system.
Once you make that shift, time becomes your primary control and weight loss becomes your validation. The curve becomes a tool for understanding how the machine is behaving, and using that to produce repeatable results.
Ask yourself after each roast
- Did this roast reach 200°C faster or slower than last time?
- Did the curve shape change after the fan step?
- Did the overall shape look different from previous roasts?
Next: From Time to Cup — TRT, Weight Loss, and Outcome
Coffee | One Roast at a Time — oneroastatatime.com
© Warren Matthews, All rights reserved.